Sub-Ether
Well-known member
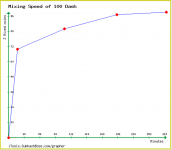
I wanted to show the mixing speed of 100 Dash, so decided to plot it, the first 70% is really quick (16 minutes) then it slows down, and models similar to a logarithmic function.
70 Dash = 16 minutes = 4.4 Dash / minute
86 Dash = 1 hr and 40 min = 0.86 Dash / min
97.3 Dash = 3hr and 14 min = 0.5 Dash / min
99.4 Dash = 4 hr and 43 min = 0.35 Dash / min
70 Dash = 16 minutes = 4.4 Dash / minute
86 Dash = 1 hr and 40 min = 0.86 Dash / min
97.3 Dash = 3hr and 14 min = 0.5 Dash / min
99.4 Dash = 4 hr and 43 min = 0.35 Dash / min
Attachments
Last edited by a moderator: